Marketing Insights
Interpreting Google Analytics
Google Analytics is a great tool, but determining the meaning of each of its metrics can sometimes be confusing. In this article, we clear up any confusion you may have on certain data terms to ensure you are interpreting your Google Analytics data correctly.
If you are a beginner with Google Analytics, check out our beginner’s guide and our article on the best reports to look at in Google Analytics.
Below are Google Analytics’ most common points of confusion and important data pieces explained in depth to help you interpret your Google Analytics reports.


Users refers to the actual people visiting your website, and sessions are counted when a user enters your website. Users can have multiple sessions if they visit your website more than once in the time period selected. Both users and sessions are important––neither is more important than the other.
A session refers to the entire time a person is on your website, whether they spend time on one page or five. Pageviews refer to the total number of pages viewed within each session; multiple views of pages are counted in this statistic. A session is a more important metric to measure than pageviews because it groups each pageview together in its relationship to the user.

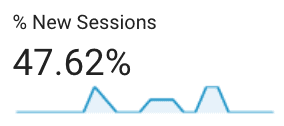
The percentage of new sessions is an estimate of the percentage of total sessions that were made by new visitors (users who have never been to your website before). This is a good indicator to check if you have just launched a new marketing campaign and are trying to drive more people to your website. It is a good metric to track month to month to determine how many new people are coming to your website.
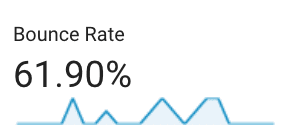 A bounce rate is the percentage of sessions that occurred when a user only accessed one page of your website and did not interact with it, meaning that they did not scroll down, click any links, or go to any other pages of your website. This metric is calculated by dividing single-page sessions by all sessions. A high bounce rate is usually a good indicator that your page is not well received by the user and that users are not engaging with your content. If you provide quick information on your website, a high bounce rate may occur because the user is finding what they need quickly and leaving. If your end goal is to have people explore your website and engage with the content, you want your bounce rate to be low. We like to say that a good bounce rate is no higher than 75%.
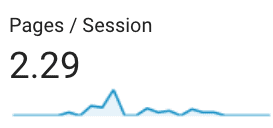
Pages/session refers to the average number of pages on your website that users are viewing per session. You generally want this number to be high, which will indicate that a large number of your website’s pages are being explored each time someone comes to your website.
![]()
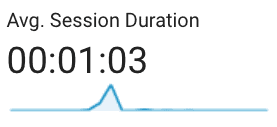
The average session duration refers to the average time users have spent on your website. Along with pages/session, you want this number to be high, indicating that users are spending more time on your website and interacting with your content.
The source/medium can be confusing if you are new to Google Analytics. The source refers to where the user was when he or she saw your content, such as in a Google search result, on Facebook, and so on. The medium refers to how the user got to your website, such as organically, in an email, and so on. Here are some common sources/mediums and what they mean:
- google/organic: Google’s search engine
- (direct)/(none): Google Analytics is unable to track where these visitors came from
- google/cpc: PPC campaign
- facebook.com/referral: Facebook on a mobile device
- bing/organic: Bing’s search engine
- co/referral: Twitter
![]()
Channels are the routes users take to visit your website. They are the mediums grouped together with several traffic sources. Here is what each of them mean:
- Organic: visits from organic search results from search engines
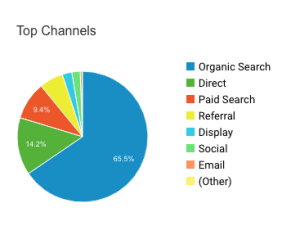
- Direct: visits from a visitor typing your exact URL or visits from places that Google cannot determine ([direct)/(none] is the source/medium)
- Social: visits from social networking platforms such as Facebook, Twitter, and Instagram
- Email: visits from links clicked in emails
- Paid Search: visits from search PPC campaigns
- Referral: visits from links clicked on other websites
- Display: visits from display advertising like remarketing or banner ads
- (Other): visits that cannot be tracked by Google and are most likely spam
The above are just the most common data within Google Analytics to look at; Google provides an enormous amount of data and reports to help grow your online presence. If you own a business or website and are struggling to understand your Google Analytics, contact us. We regularly design, host, track, and optimize websites for our clients.
If you would like more information regarding Google Analytics or Google Tools, check out our six-part Google series on our blog.
About Ocreative
Ocreative is an integrated marketing agency, with expertise and broad experience that spans both print and digital media. It is in the bedrock of the company to offer the highest level of customer service, a quality worthy of awards, and performance that surpasses client expectations. Ocreative is located just outside Milwaukee and works with clients locally, nationally, and globally. Their clients have access to some of the most fun and knowledgeable professionals around—those who inspire, educate, and problem solve. The agency provides marketing and brand strategy, advertising and design, website design and social media, and video expertise to their clients, fulfilling their desire for business growth and their aspiration to leave a substantial footprint on their industry.


